
By Richard Works
During the past few decades, a combination of decreasing fertility rates and increasing life expectancies has aged the U.S. population and labor force. The labor force is getting older if the share of those under 25 years of age declines, or if the share of those 55 years and older increases. By 2026, the labor force should be much older and the average age of the labor force will have increased. In this article we’ll take a look at the employment projections from the Bureau of Labor Statistics through 2026.
The civilian noninstitutional population is projected to grow by 24.6 million, reaching 278.2 million in 2026. The percentage of the youth (16 to 24) and the prime age (25 to 54) groups in that population are will decline over the period (see figure 1). In contrast, the percentage of those 55 years and older are projected to increase significantly. These changing demographics in the population will effect on the labor force, economy, and employment over the decade. The overall labor force participation rate will decline as older workers leave the labor force, putting a constraint on economic growth. The aging baby-boomers will drive demand for healthcare services and related occupations.
Figure 1. Population share by age group
The overall labor force participation rate peaked at 67.1 percent from 1997 to 2000. After the 2001 recession, it trended downward. In the aftermath of the 2007–09 recession, the overall labor force participation rate plunged sharply and continued a decline, registering at 62.7 percent in 2015. It changed slightly in 2016, increasing by 0.1 percentage point to 62.8 percent. As a result, the labor force participation rate had dropped by 4.3 percentage points by 2016 from its peak in 2000.
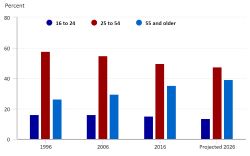
The continued shift of the population into older age groups will have effects on the labor force and the overall labor force participation rate. In 1996, the entire baby-boom generation was in the prime age group with a participation rate of 83.8 percent (see figure 2). In 2001, the first of the baby boomers moved into the 55-and-older age group. The labor force participation rate of the older age group, which had been increasing since 1995 from a rate of 30 percent, peaked in 2012 at 40.5 percent and declined slightly to 40.0 percent in 2016. The overall labor force participation rate is projected to decline in the next decade because of the labor force moving into higher age groups with lower participation rates as the population ages.
Figure 2. Labor force participation rate by age group
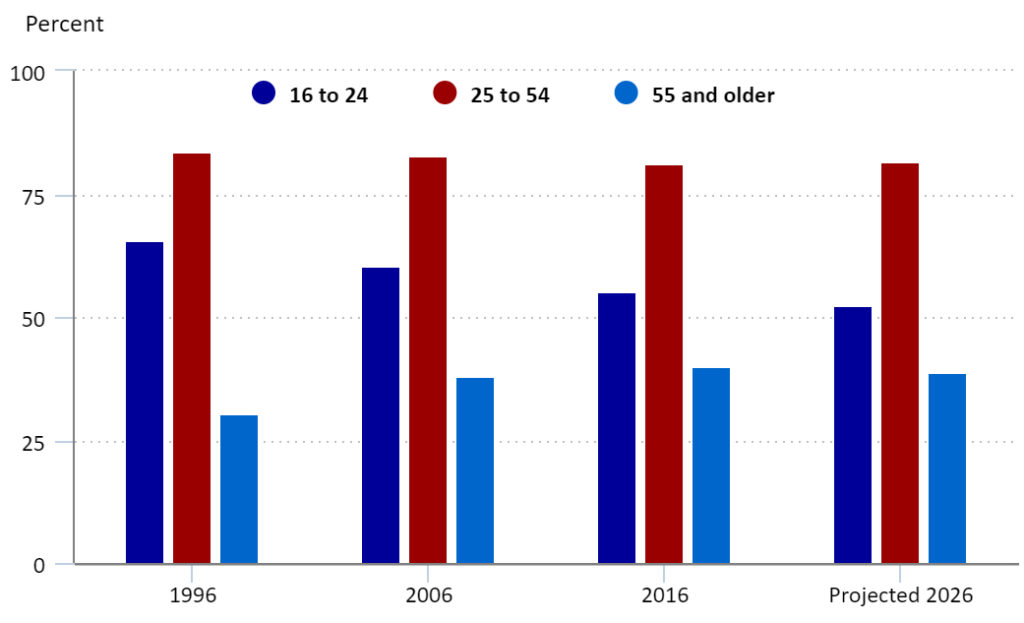
Although the participation rate of the prime age group shows the strongest attachment to the labor market, its participation rate usually has been steadily declining since 2000. Its rate is expected to change a little over the coming decade, increasing marginally from 81.3 percent to 81.6 percent. With increased school enrollment at all levels, more young people than ever before are continuing their education in hopes of gaining better employment. The participation rates of both 16-to-19-year-olds and 20-to-24-year-olds have diminished sharply over the past few decades. Their rates are expected to fall further, though at a slower pace.
The labor force in 2026 is expected to be older and more diverse. The median age of the labor force should rise a tad to 42.3 in 2026—the highest level ever recorded. The projected labor force annual growth of 0.6 percent through 2026 is because of sluggish population growth. Changes in the age composition of the population and labor force participation rates of the different age groups are expected to affect growth. The shares of both the youth and the prime age groups in the labor force will decline, whereas older workers will continue to increase their percentage to about one-quarter of the labor force by 2026. The 75-and-older group is projected to have the fastest growth.
However, BLS projections by design assume that the economy will be at full employment in the target year (2026). This assumption is useful because variations in the business cycle are not predictable over a decade. The full-employment assumption asserts that the economy is operating at a high rate of resource utilization (including employment) and that output growth is sustainable.
An aging and slowly growing population yields in slow growth for the labor force. Expectations for the overall economy are higher than they were the previous 10 years. However, economic growth levels are not expected to reach those of the 1970s, 1980s, and 1990s. Most job growth through 2026 should come from service-providing sectors, and by 2026, 81 percent of jobs are projected to be in these sectors. In addition, growth of real output from service-providing sectors will be somewhat quicker than that of the overall economy. Those occupations related to healthcare will have the fastest employment growth through 2026. Rapid industry growth will cause growth in healthcare occupations to be much faster than the average for all occupations because of the needs of the aging baby-boom generation and of an increasing number of people with chronic conditions.

Bureau of Labor Statistics – Washington, D.C.
[email protected]
www.bls.gov